
Summary
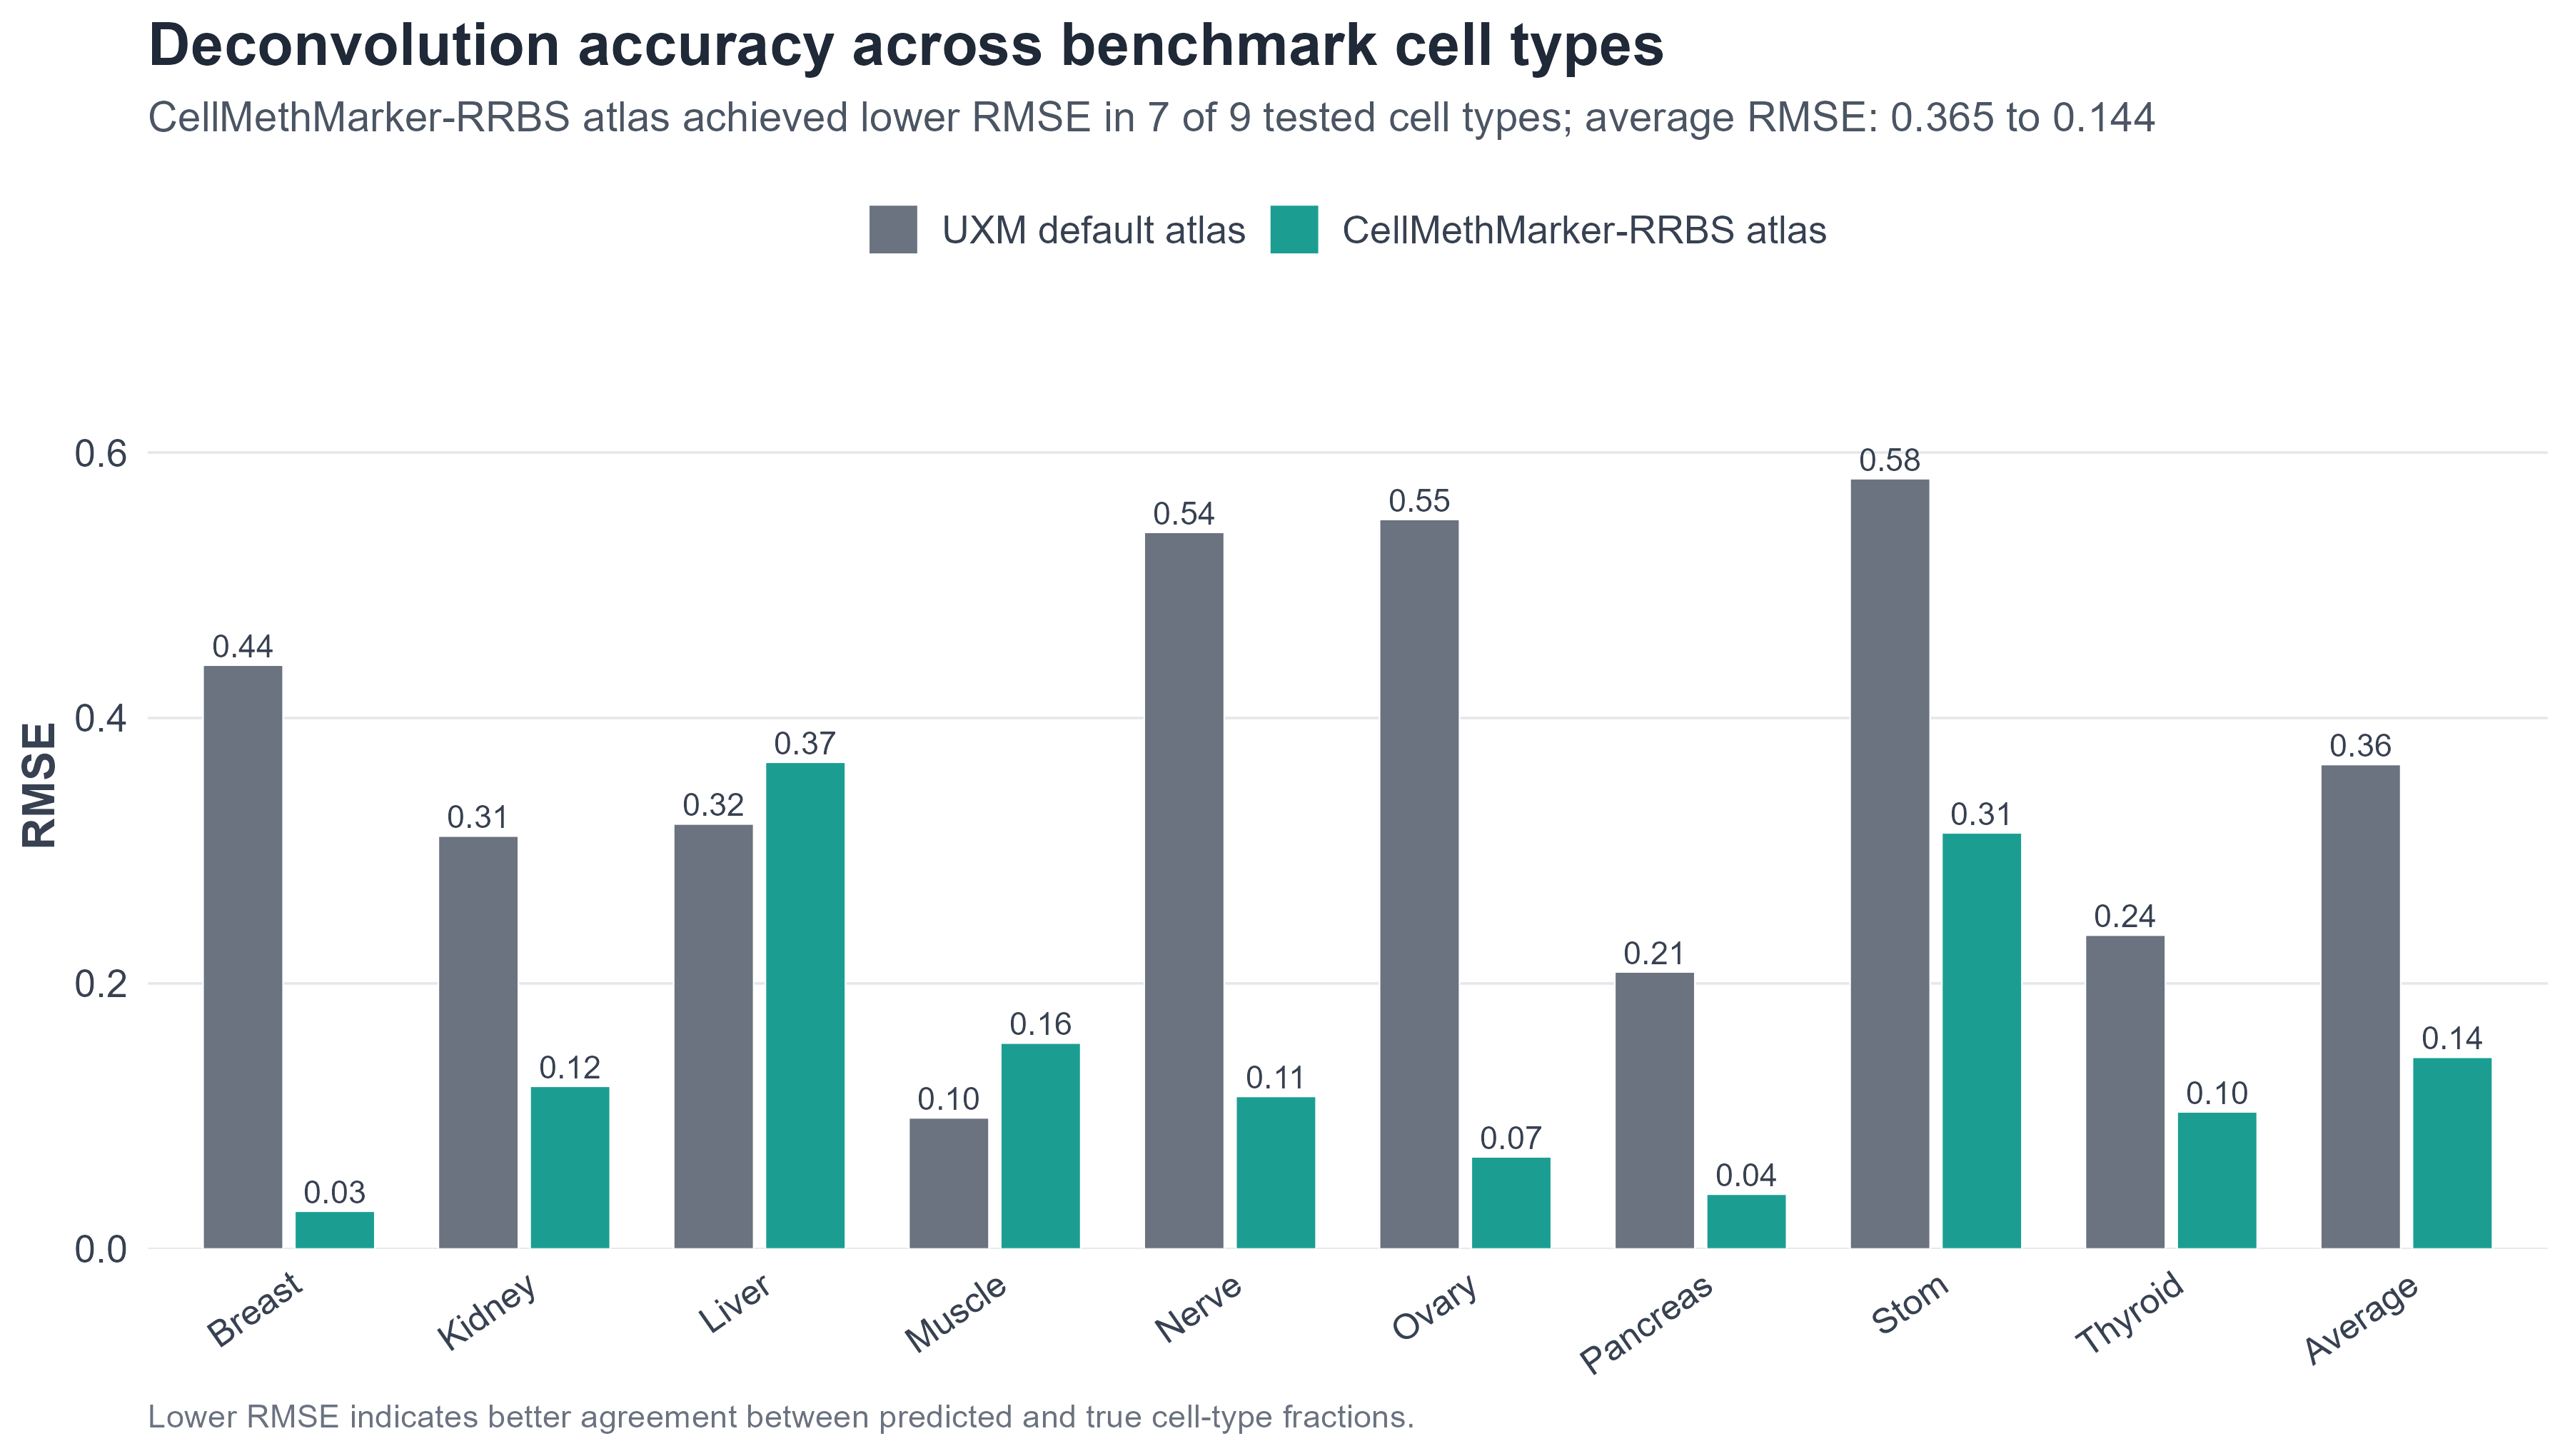
Take-home message. CellMethMarker custom markers can be used to construct a platform-matched RRBS reference atlas for UXM-based methylation deconvolution. In this benchmark, the CellMethMarker-derived RRBS atlas achieved lower RMSE in 7 of 9 tested cell types and reduced the average RMSE from 0.365 to 0.144 compared with the UXM default WGBS atlas.
Background
Reference-based methylation deconvolution estimates cell or tissue composition by comparing mixed methylomes with a reference atlas of cell/tissue-specific methylation signatures. Its accuracy depends on marker coverage, reference quality and compatibility between the input assay and the reference atlas.
UXM provides a fragment-level deconvolution framework with a default WGBS-derived atlas. Because RRBS captures a more restricted CpG-rich feature space, we tested whether an RRBS-matched reference atlas built from CellMethMarker custom markers could improve UXM performance for RRBS benchmark samples.
Benchmark design and methods
We split CellMethMarker-associated RRBS samples into independent testing and reference-building sets. A subset of samples was held out for evaluation, while non-overlapping quality-controlled samples were used to construct a UXM-compatible RRBS reference atlas. Atlas construction followed the reference-generation logic of the UXM deconvolution workflow: https://github.com/nloyfer/UXM_deconv.
- Input markers: CellMethMarker RRBS custom marker regions.
- Reference atlas: high-quality RRBS reference samples converted into a UXM-compatible atlas.
- Test set: held-out RRBS samples from the same benchmark cell/tissue categories.
- Comparison: UXM was run with either the default WGBS atlas or the CellMethMarker-derived RRBS atlas.
- Metrics: RMSE, R2 and Pearson correlation between expected and predicted cell/tissue fractions.
Results
The CellMethMarker-derived RRBS atlas reduced prediction error for most benchmark cell types. It achieved lower RMSE in seven of nine tested cell types and improved both average RMSE and average R2 compared with the UXM default atlas.
UXM default WGBS atlas
UXM + CellMethMarker-RRBS atlas
Visual evidence
RMSE directly measures prediction error; lower values indicate better agreement between expected and predicted cell/tissue fractions.
Cell-type-level performance
| Cell type | RMSE: UXM default atlas | RMSE: CellMethMarker-RRBS atlas | Lower RMSE |
|---|---|---|---|
| Breast | 0.440 | 0.028 | CellMethMarker-RRBS |
| Kidney | 0.311 | 0.123 | CellMethMarker-RRBS |
| Liver | 0.320 | 0.367 | UXM default |
| Muscle | 0.099 | 0.155 | UXM default |
| Nerve | 0.540 | 0.115 | CellMethMarker-RRBS |
| Ovary | 0.550 | 0.069 | CellMethMarker-RRBS |
| Pancreas | 0.209 | 0.041 | CellMethMarker-RRBS |
| Stom | 0.580 | 0.313 | CellMethMarker-RRBS |
| Thyroid | 0.236 | 0.103 | CellMethMarker-RRBS |
| Average | 0.365 | 0.144 | CellMethMarker-RRBS |
Suggested workflow for users
- Select relevant cell/tissue types and marker regions from CellMethMarker.
- Prepare reference methylation samples matched to the input assay, preferably RRBS for RRBS input data.
- Construct a UXM-compatible reference atlas from CellMethMarker markers and user-selected reference samples.
- Run UXM deconvolution using the customized platform-matched atlas.
- Validate predictions using known mixtures, control samples or expected tissue composition when available.
Notes and limitations
This result supports the use of CellMethMarker markers for constructing deconvolution references, but it does not imply that one fixed atlas will outperform all existing references in every dataset. Performance may vary with sequencing platform, marker coverage, cell/tissue composition, reference sample quality, disease state and batch effects.
Users are encouraged to build study-specific reference atlases using CellMethMarker markers and their own reference samples when applying methylation deconvolution to new datasets.
Related method: UXM deconvolution reference-building workflow, https://github.com/nloyfer/UXM_deconv.